Stock Price Prediction ML
Analyzing the Impact of Tweet Sentiment on Stock Price Prediction using LSTM Models
Research Overview
This study investigates whether incorporating Twitter sentiment analysis improves LSTM neural network models for stock price prediction. Testing three major technology stocks (Apple, Tesla, Microsoft) using rigorous cross-validation, we found that sentiment-enhanced models consistently underperformed baseline models by 55-104%, contradicting our initial hypothesis.
The research employed comprehensive feature engineering including 13 technical indicators combined with 3 sentiment metrics, advanced multi-layer LSTM architectures with regularization, and rigorous 3-fold time series cross-validation. Statistical analysis using paired t-tests revealed that sentiment-enhanced models consistently underperformed baseline models.
Authors & Affiliations
| Author | Affiliation | Role |
|---|---|---|
| Leo Chang | Princeton Day School, Princeton, NJ | Lead Researcher |
| Aditya Saraf | Cornell University, Ithaca, NY | Co-Researcher |
| Jenjen Chen | Yardley, Pennsylvania | Research Collaborator |
Key Research Findings
Performance Degradation
Sentiment-enhanced models showed 55-104% RMSE increase across all tested stocks.
Microsoft Significance
Microsoft comparison reached statistical significance, confirming sentiment worsened predictions.
Overfitting Evidence
Time series cross-validation revealed consistent overfitting in sentiment-enhanced models.
Noise vs Signal
Twitter sentiment contained more noise than predictive information for large-cap stocks.
Technical Implementation
Machine Learning
Data Processing
Sentiment Analysis
Financial Data
Research Methodology
| Step | Phase | Description |
|---|---|---|
| 1 | Data Collection | Gathered historical stock data for AAPL, TSLA, and MSFT from Yahoo Finance API covering September 2021-2022, plus 80,000+ labeled tweets from Kaggle datasets. |
| 2 | Feature Engineering | Implemented 13 technical indicators (RSI, moving averages, volatility) and 3 sentiment metrics (polarity, subjectivity, tweet volume) with proper normalization. |
| 3 | Model Architecture | Designed baseline LSTM (single layer, 32 units) and sentiment-enhanced LSTM (2 layers: 64/32 units) with dropout regularization. |
| 4 | Rigorous Validation | Applied 3-fold time series cross-validation using TimeSeriesSplit to prevent data leakage, with paired t-tests for statistical significance. |
Publication & Impact
Journal of Emerging Investigators
PEER-REVIEWED"Analyzing the Impact of Tweet Sentiment on Stock Price Prediction using Long Short-Term Memory Models"
Research Significance
This study provides rigorous evidence challenging the widespread assumption that social media sentiment enhances financial prediction models. By employing proper time series validation and statistical testing, our findings contribute valuable negative results to the computational finance literature, highlighting important limitations in sentiment-based approaches for large-cap stock prediction.
Detailed Results
| Stock | Sentiment RMSE | Baseline RMSE | Degradation | P-Value |
|---|---|---|---|---|
| Apple Inc. (AAPL) | 7.909 ± 3.854 | 5.103 ± 2.273 | 55.0% | p = 0.245 |
| Tesla Inc. (TSLA) | 24.045 ± 19.036 | 16.191 ± 5.432 | 48.5% | p = 0.409 |
| Microsoft Corp. (MSFT) | 18.174 ± 9.236 | 8.911 ± 4.534 | 104.0% | p = 0.021 * |
Research Visualizations
Comprehensive visual analysis of model performance, statistical significance, and prediction accuracy across three major technology stocks.
Model Performance Comparison
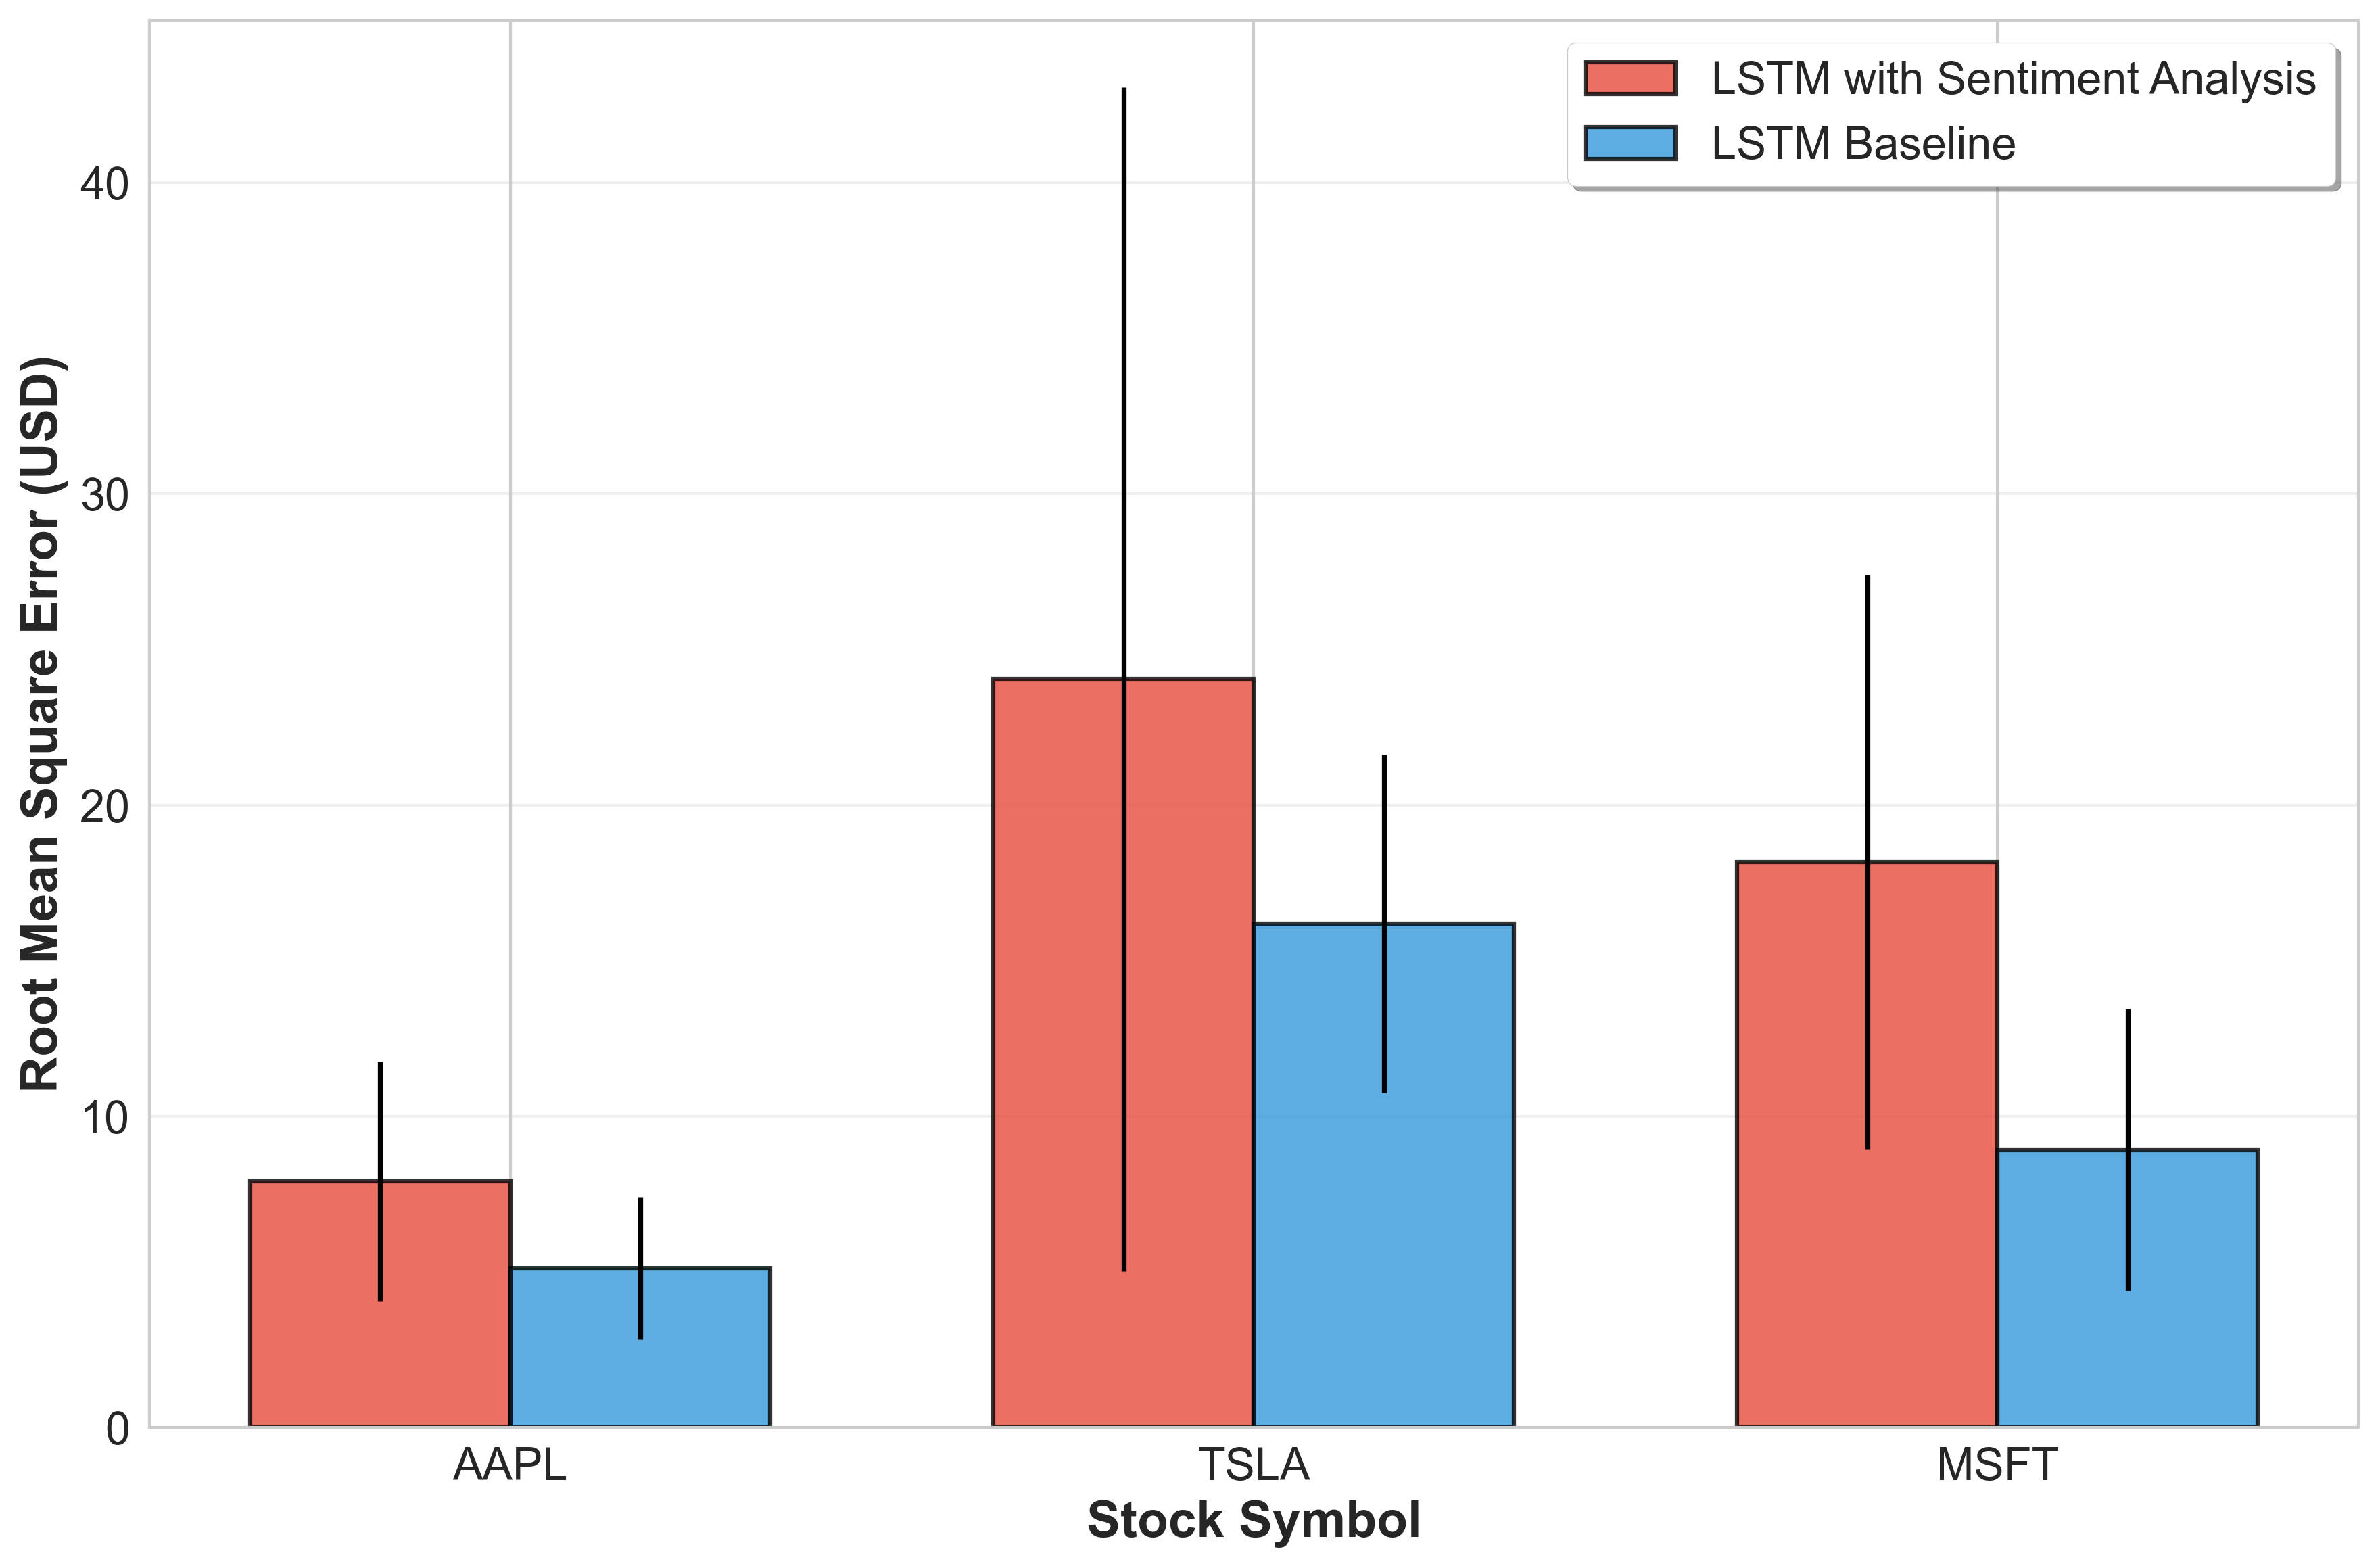
RMSE comparison showing sentiment models performed 50-104% worse than baseline across all stocks.
AAPL Price Predictions
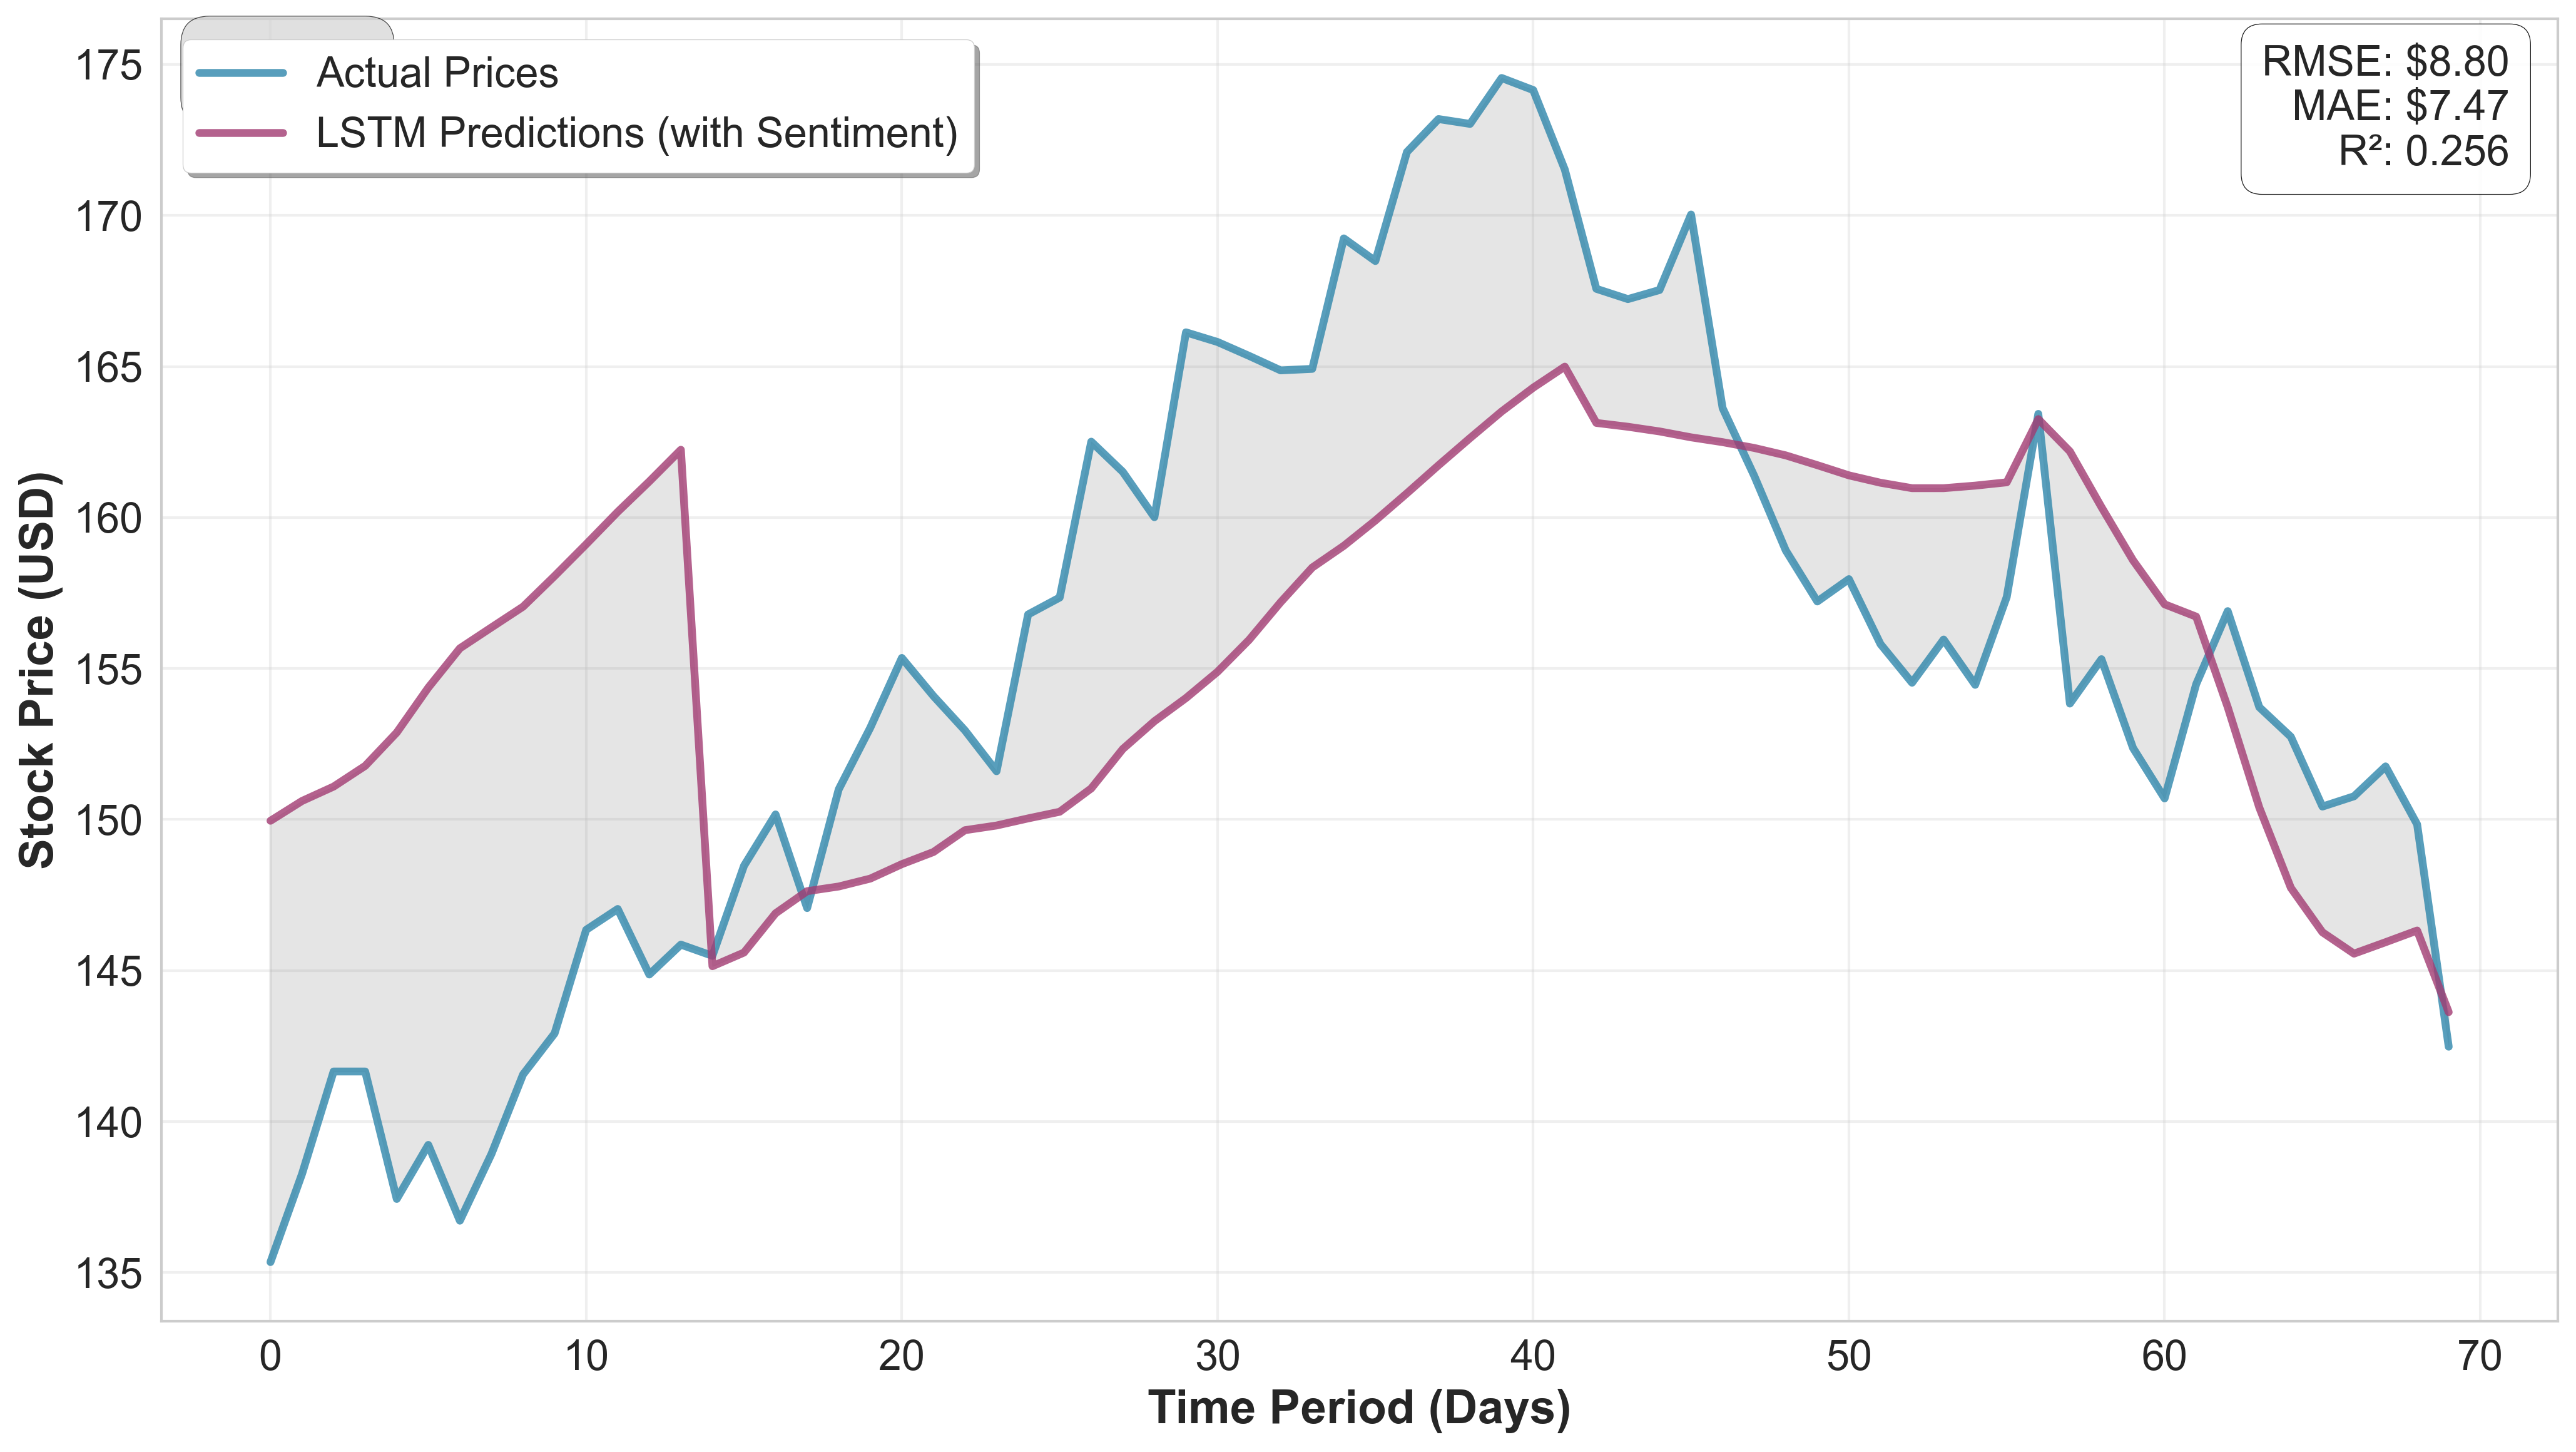
Apple stock predictions showing model lag and dampened volatility capture.
TSLA Price Predictions
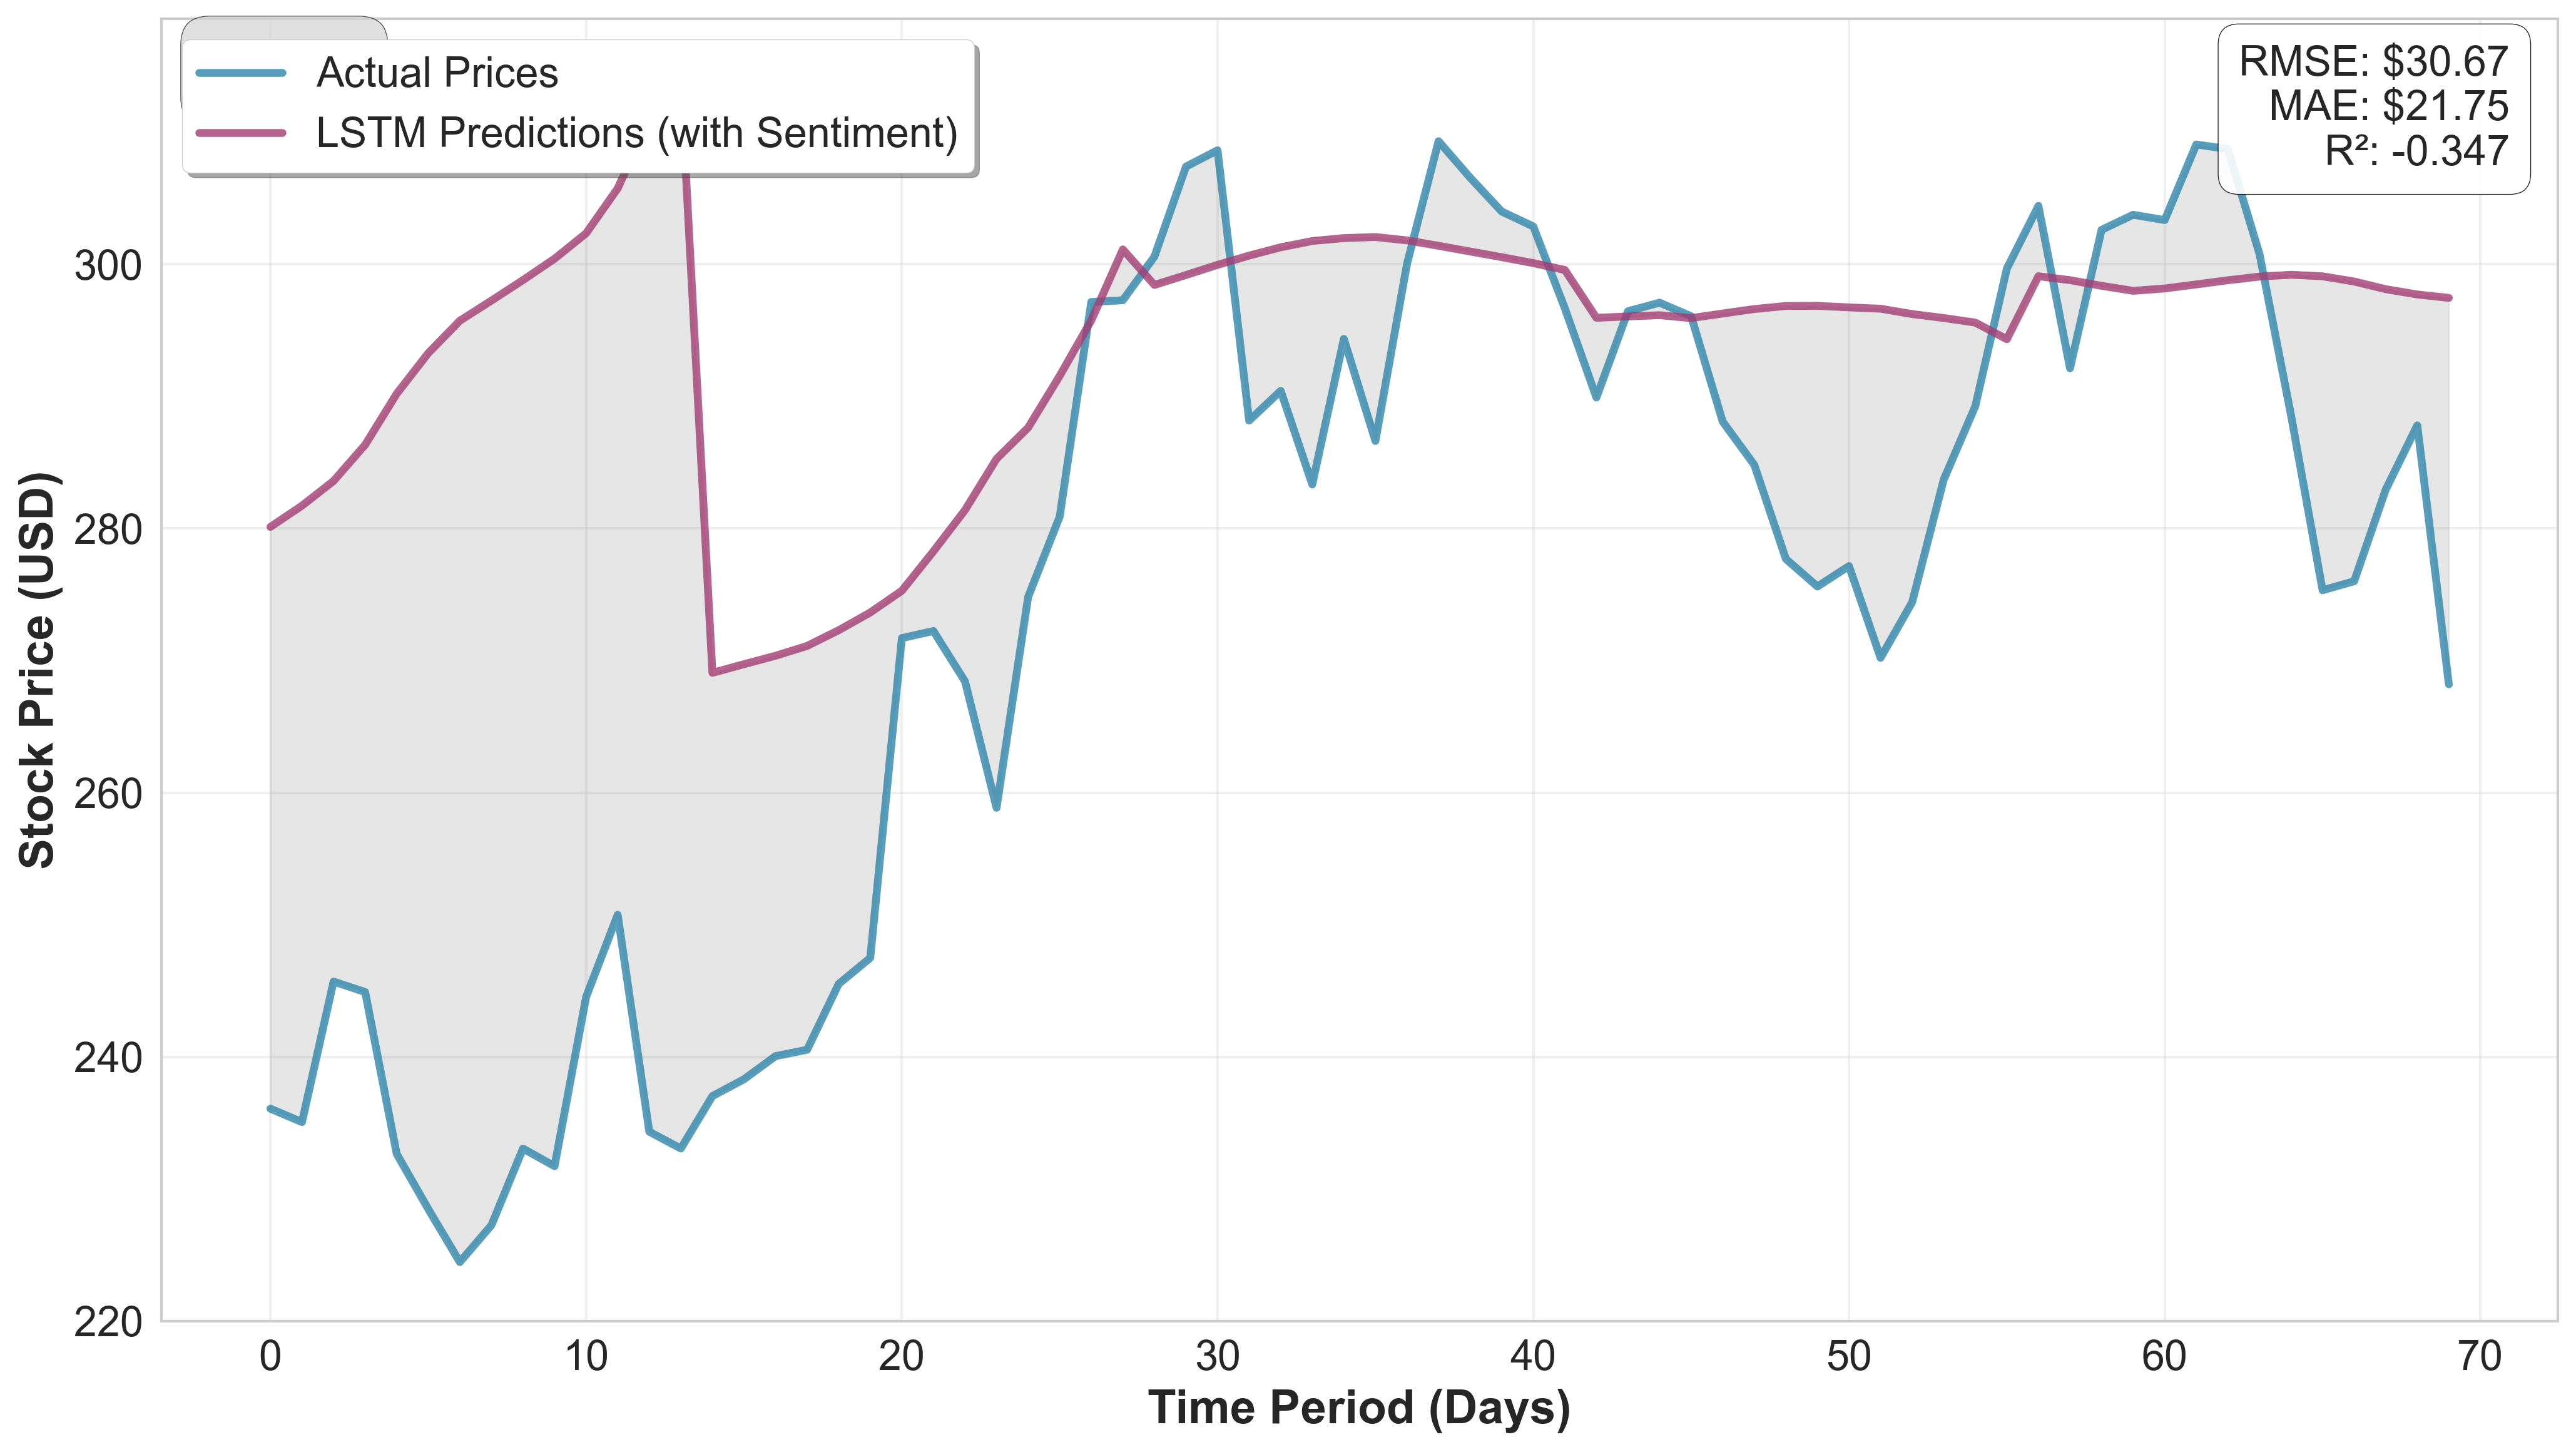
Tesla's high volatility makes it the most challenging stock to predict.
MSFT Price Predictions
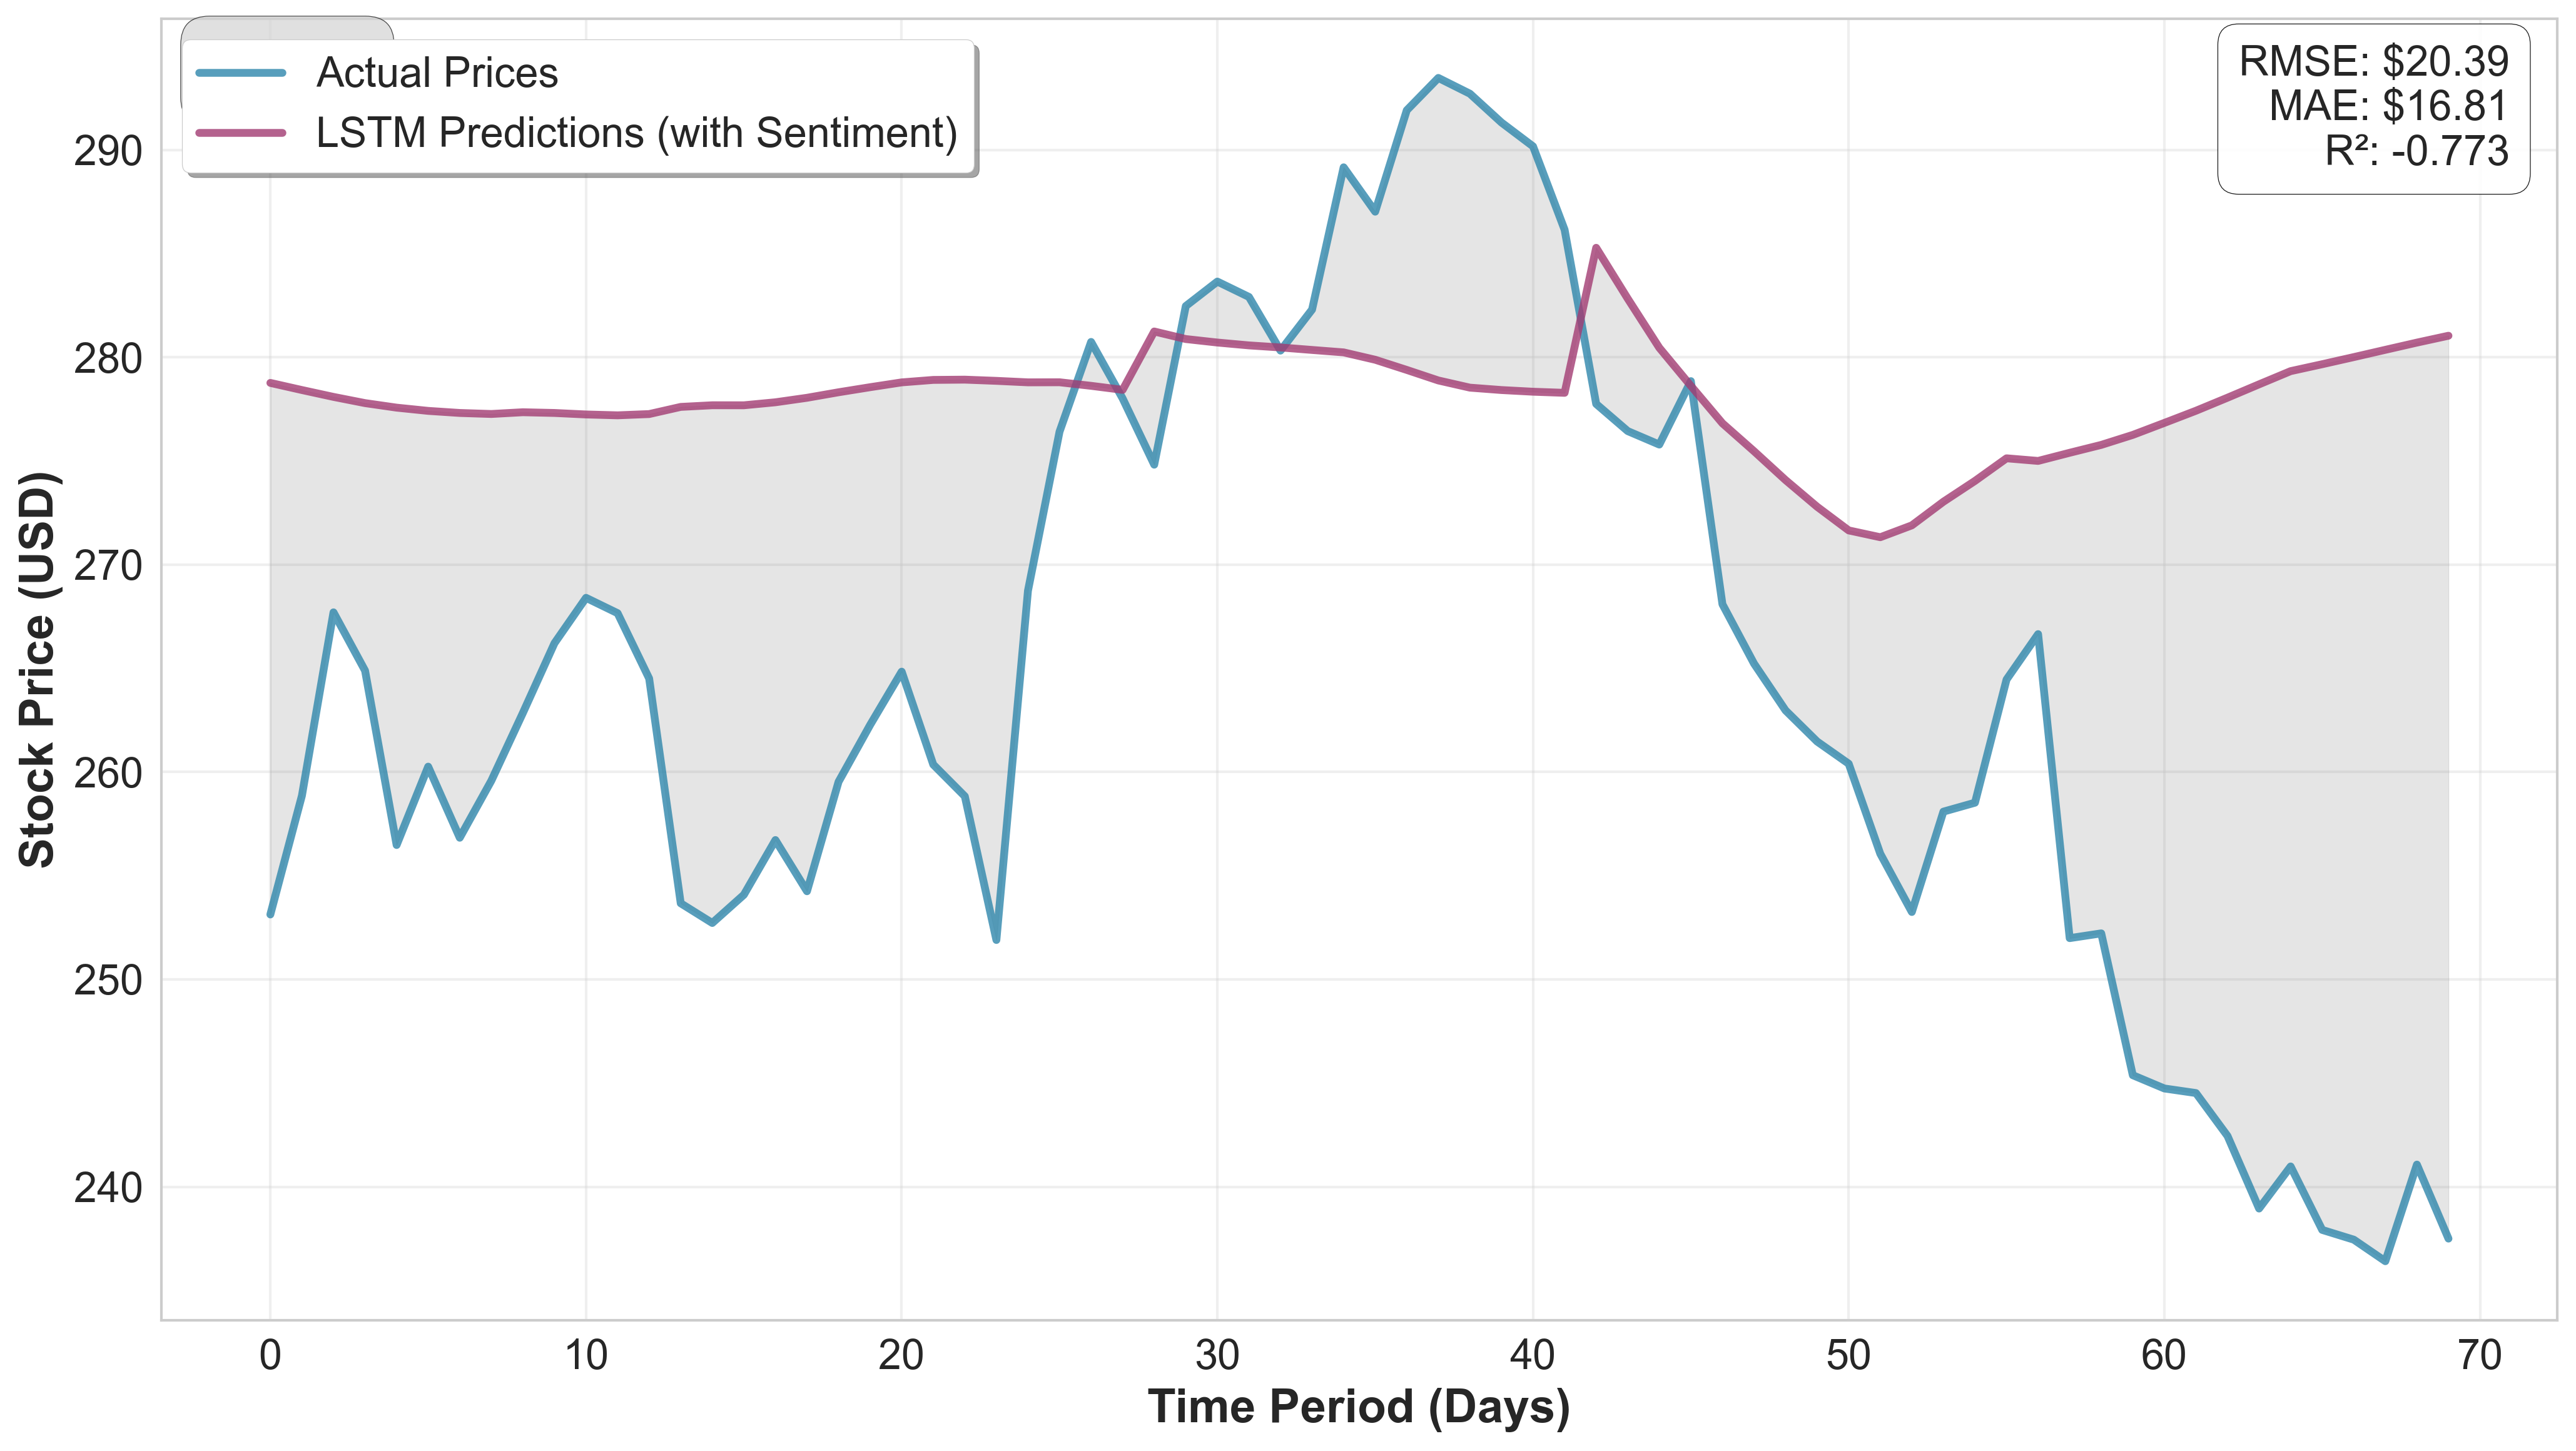
Microsoft shows consistent prediction lag despite more stable price behavior.
Statistical Significance
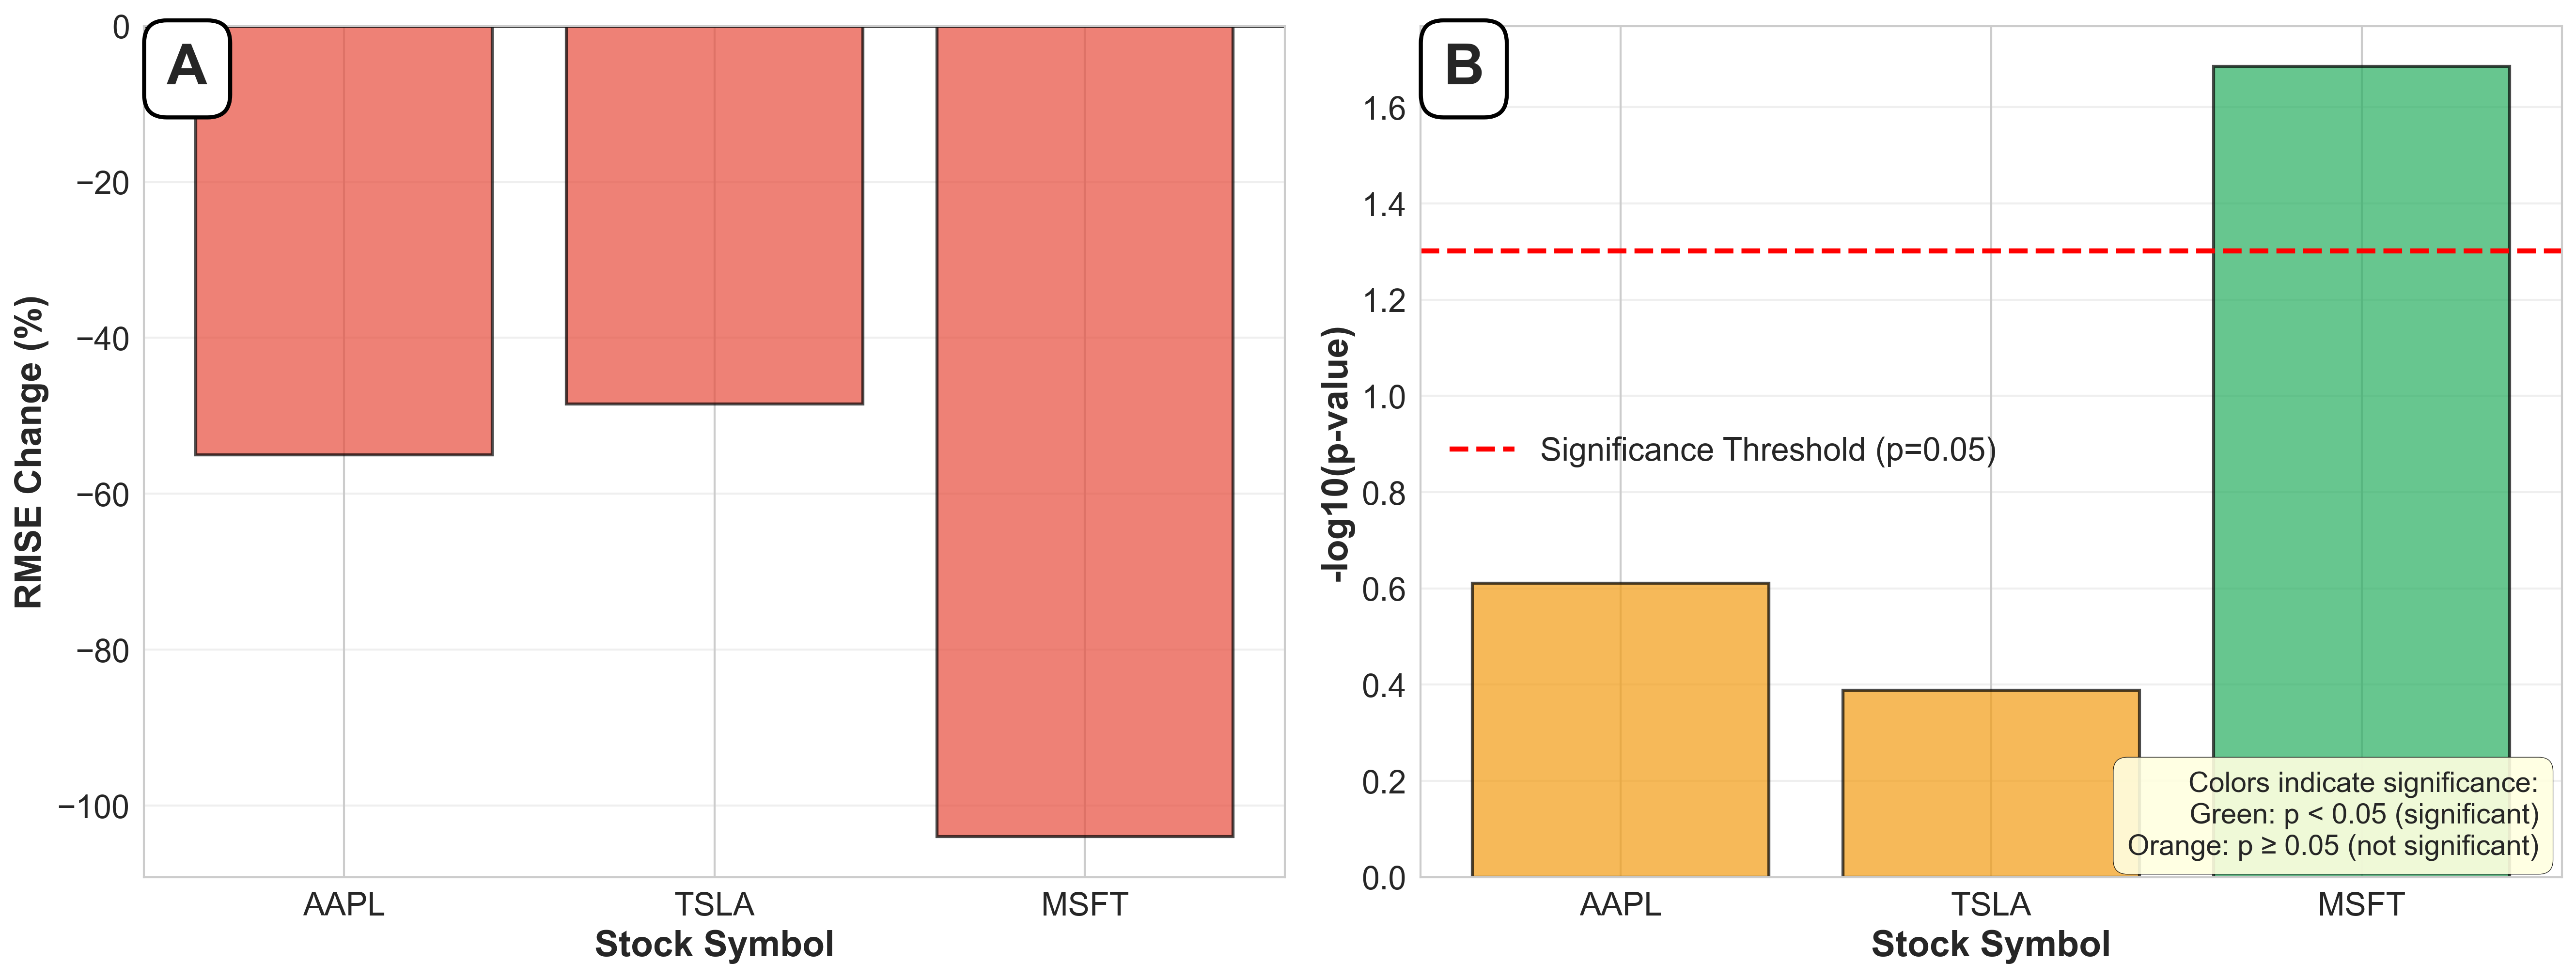
Microsoft reached significance (p=0.021), confirming sentiment degraded performance.
Feature Importance
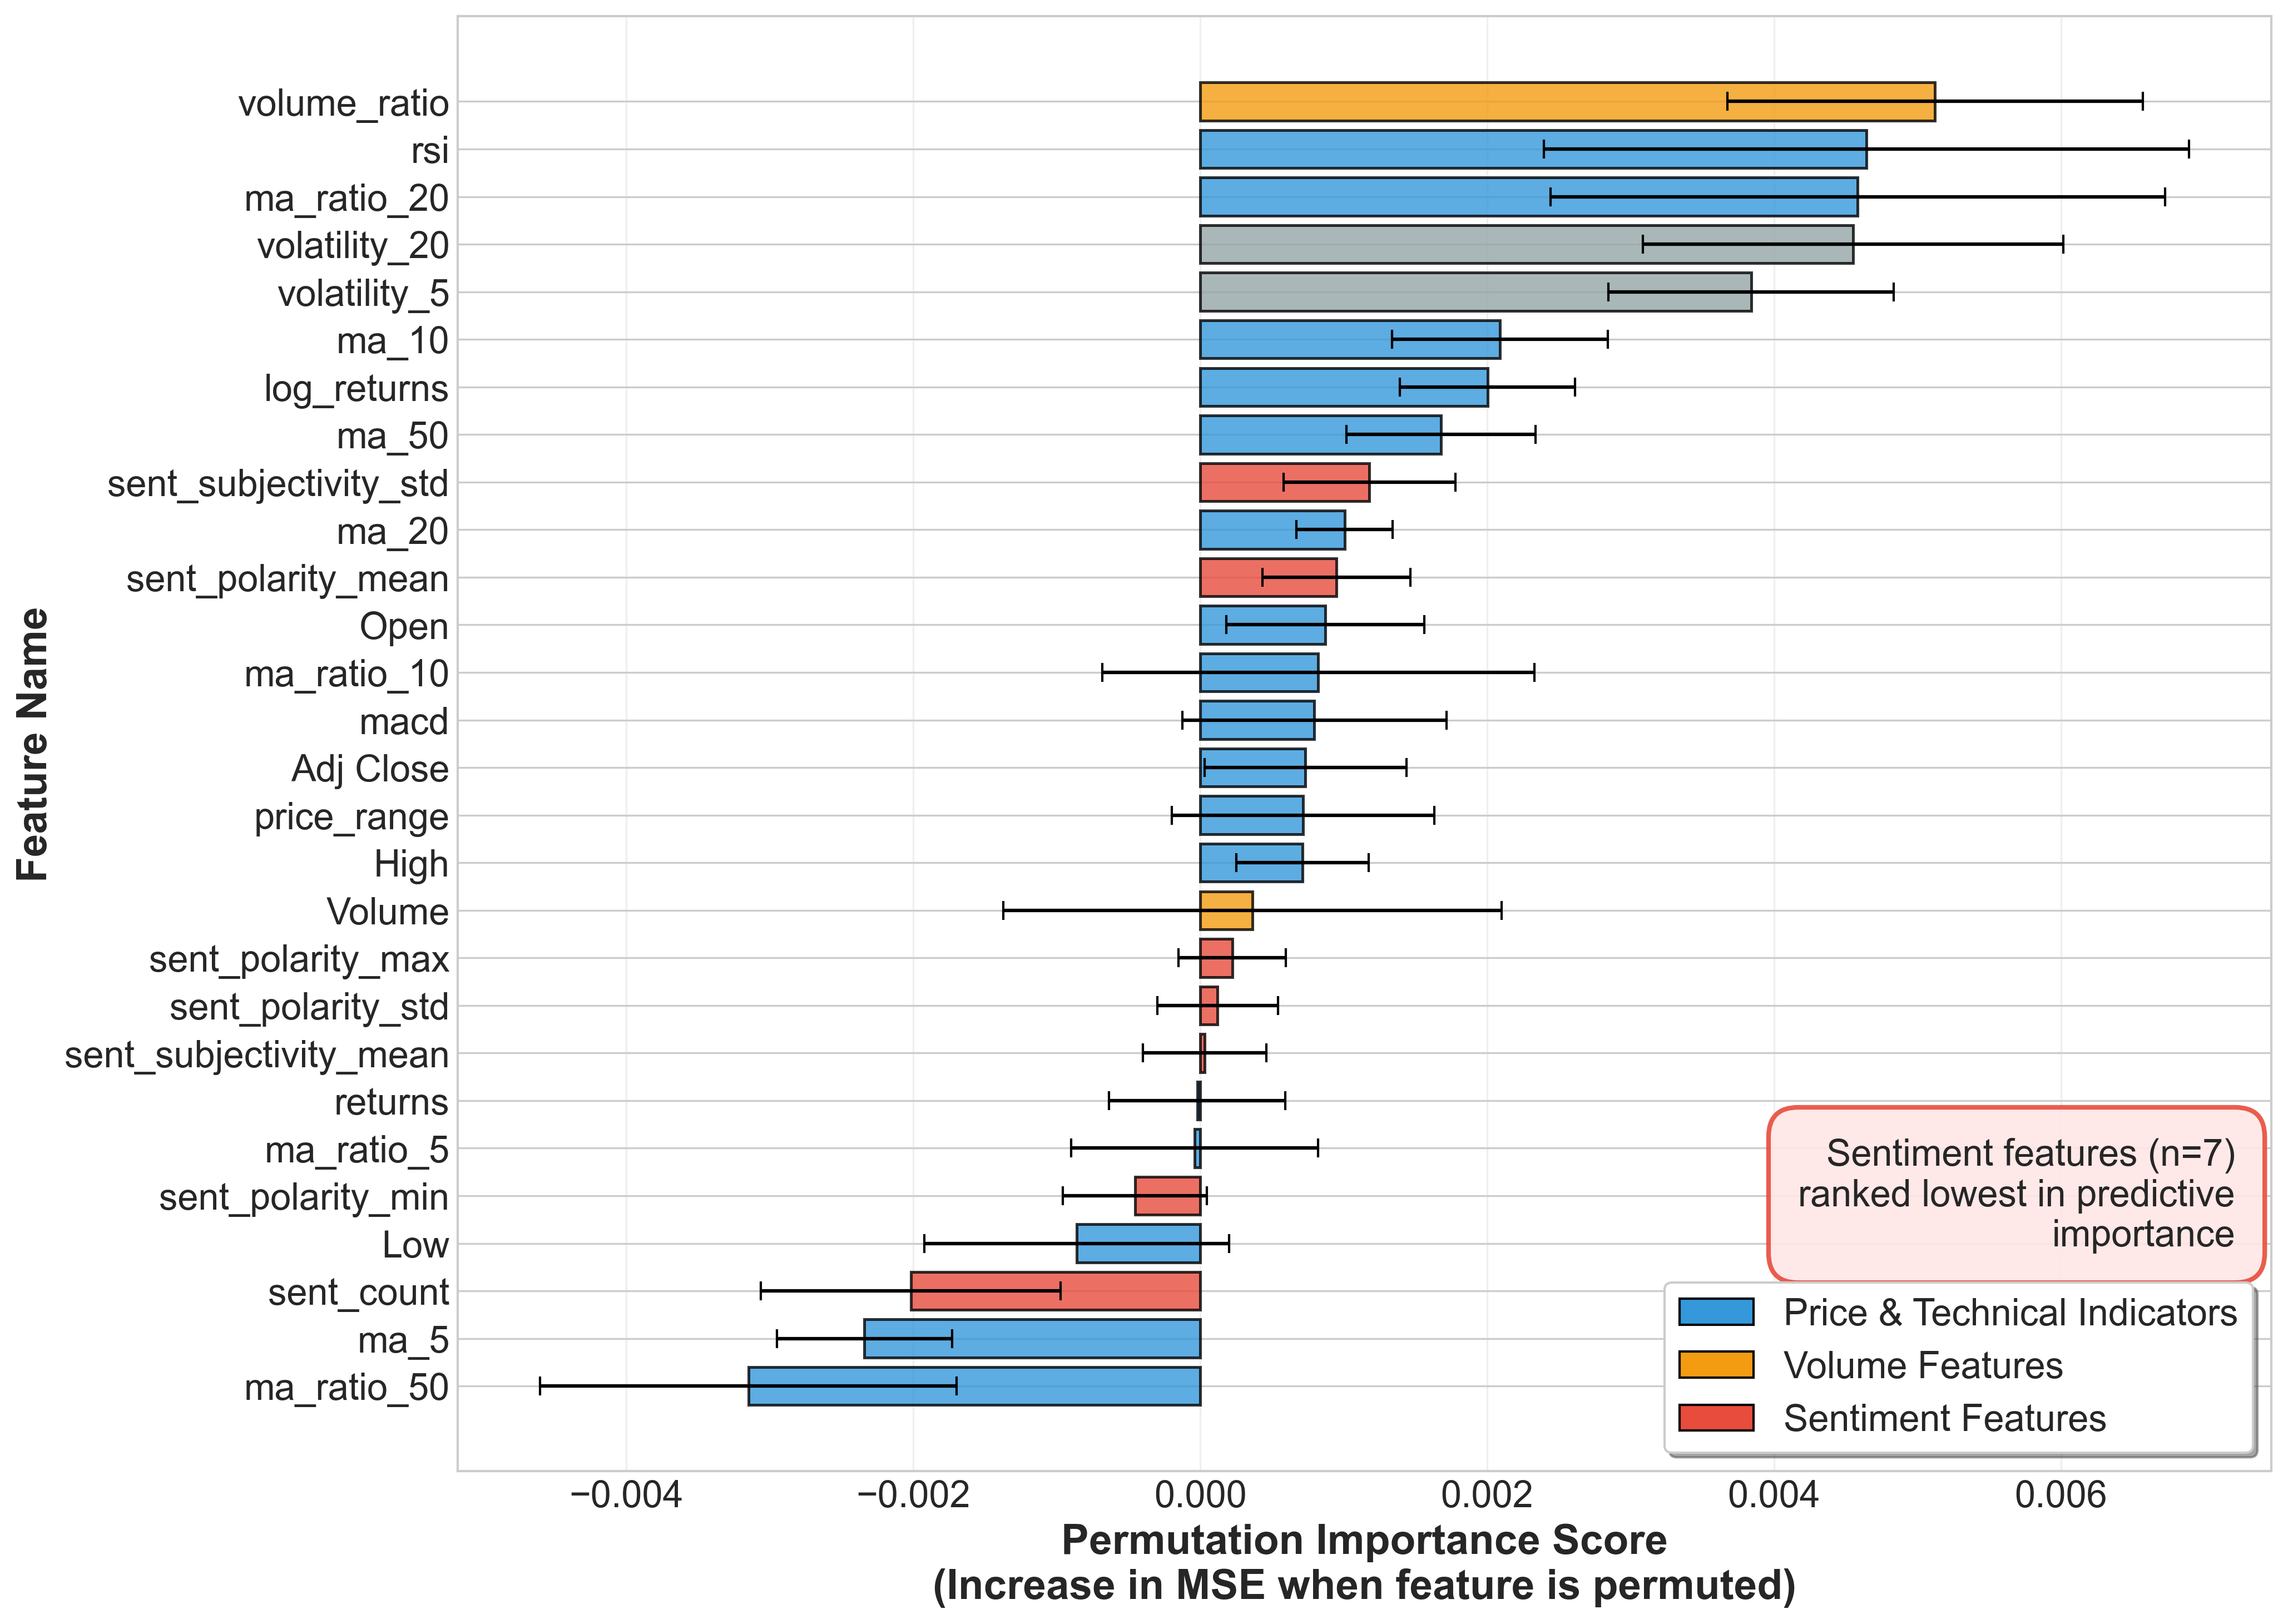
Permutation importance showing technical indicators outperform sentiment features.
Directional Accuracy
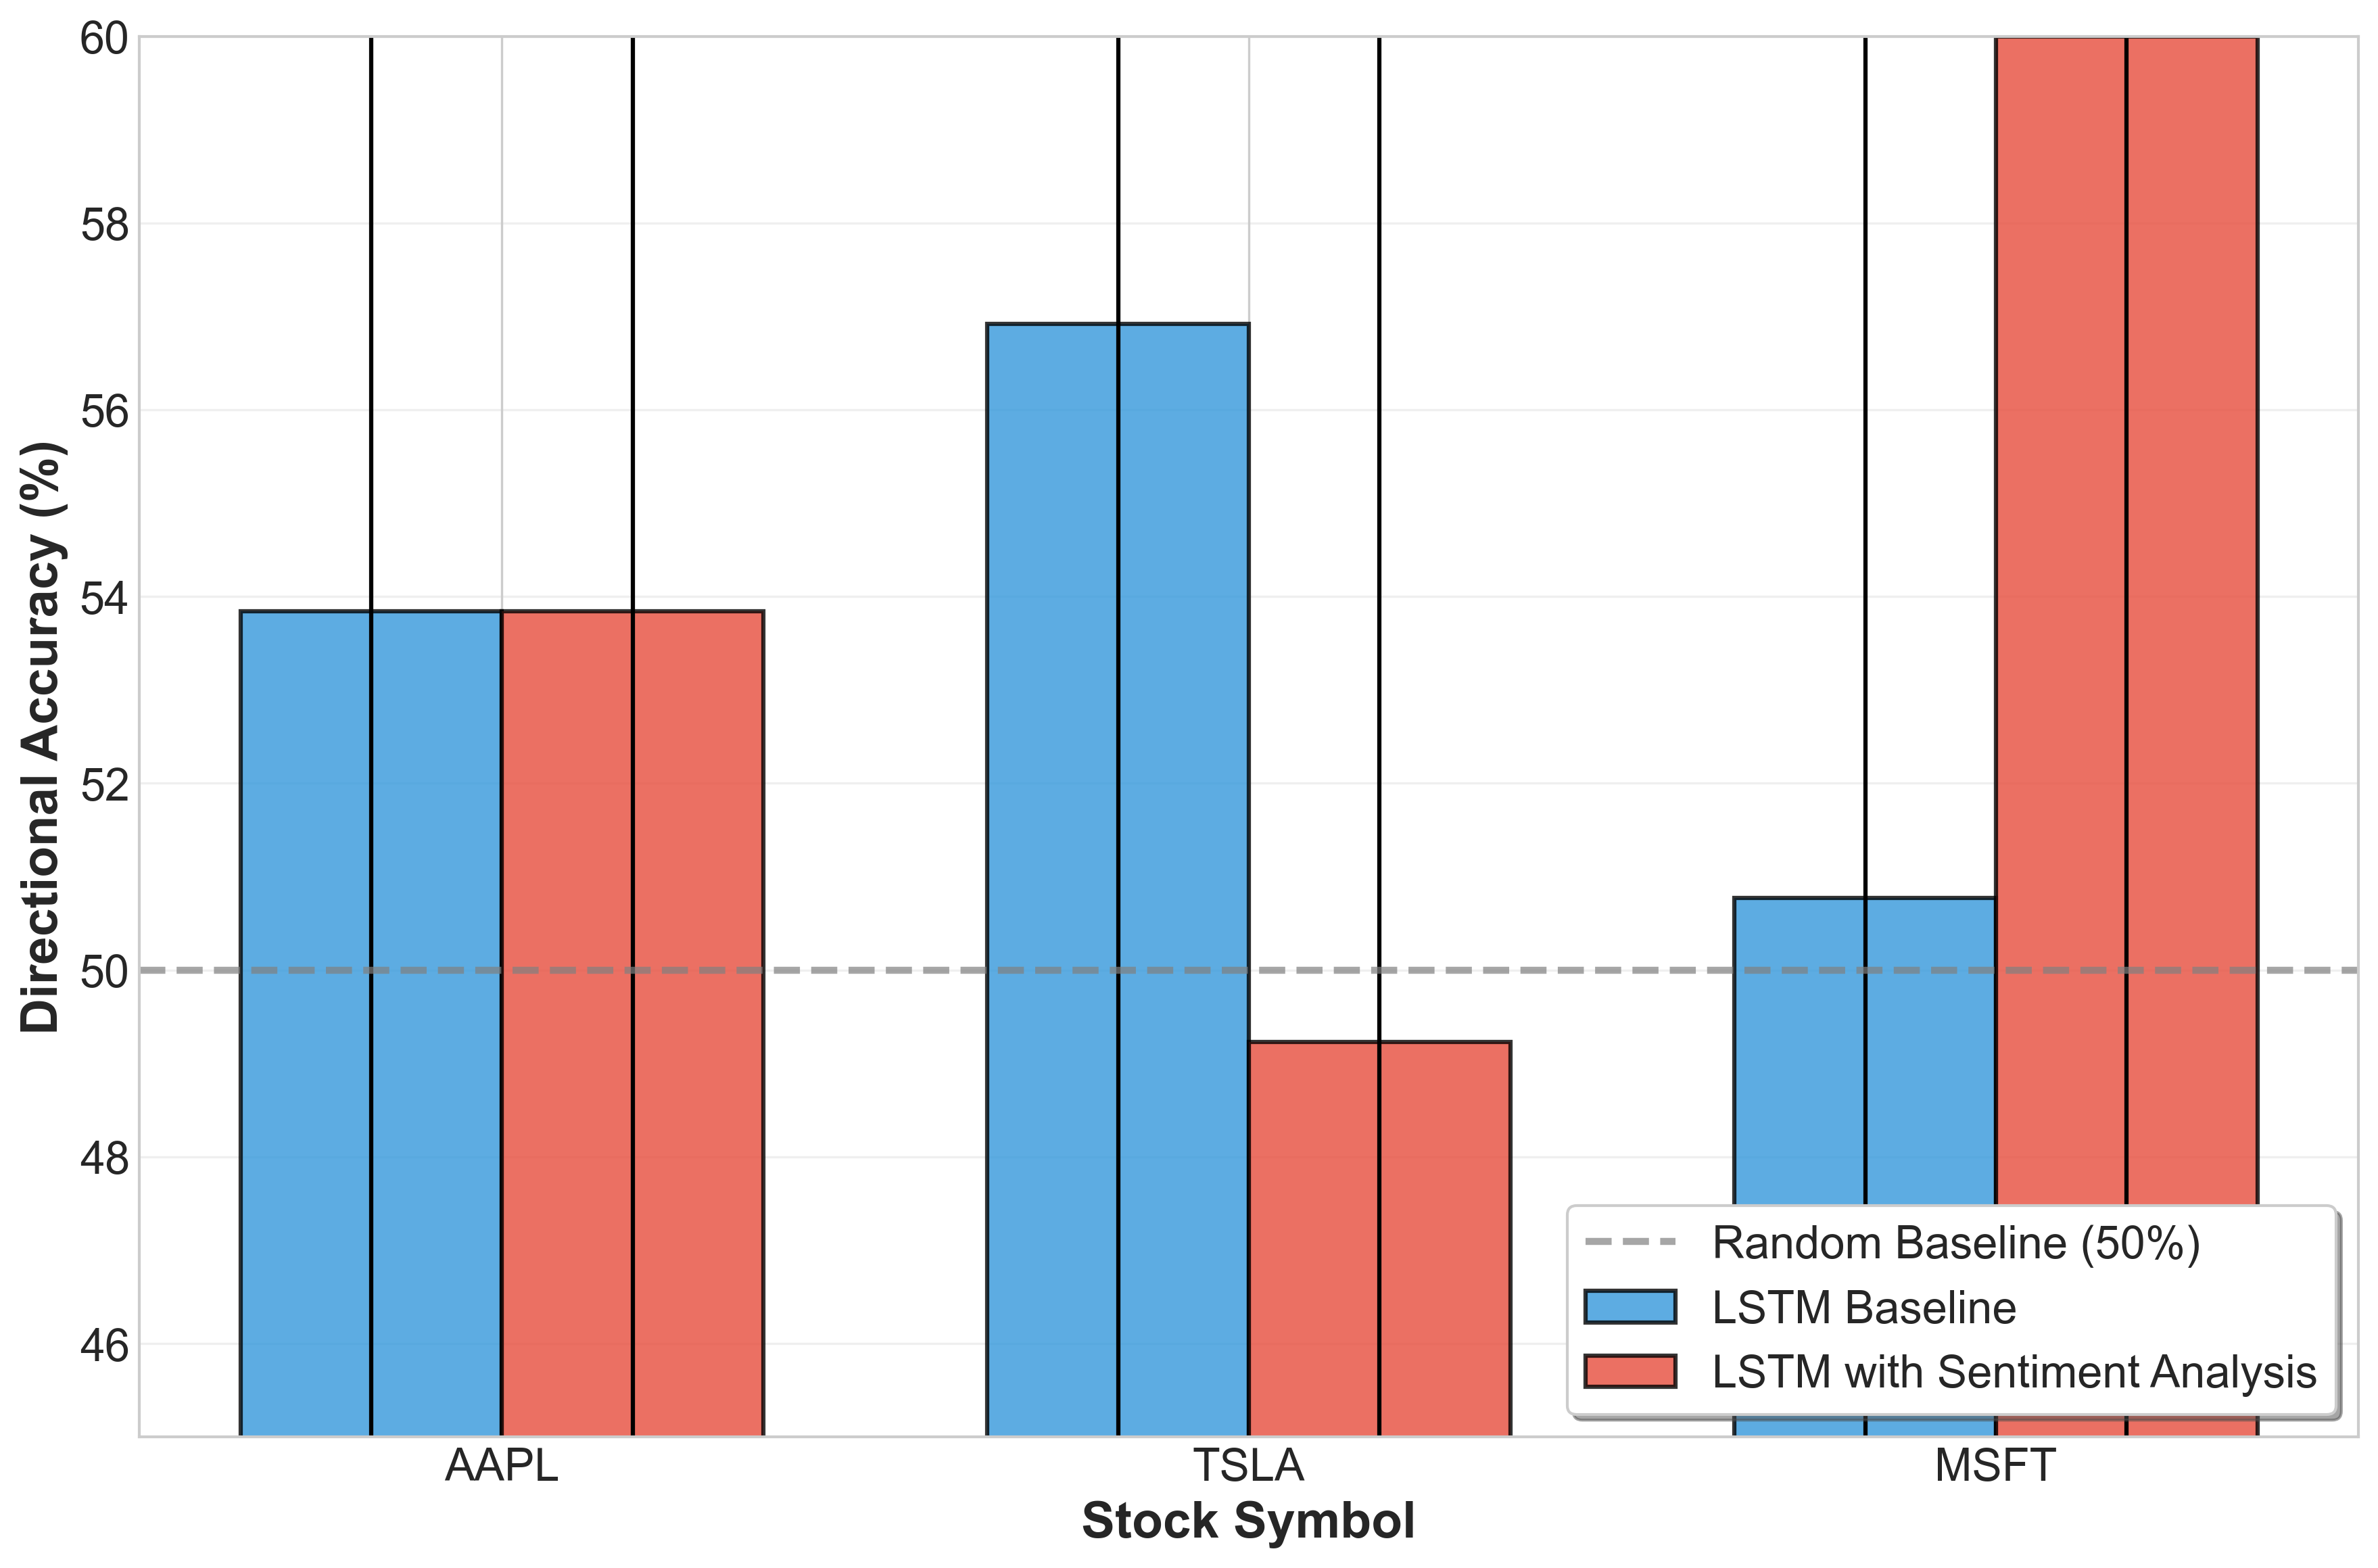
Direction prediction accuracy around 50-60%, barely better than random chance.
Code & Resources
Complete codebase including data processing, model implementation, and statistical analysis available on GitHub.